|
|
|||||||
| Heroscape Strategy Articles Heroscape Strategy Articles with discussions. Including Order Markers, Units, Game Play, etc. |
 |
|
|
Thread Tools | Search this Thread | Display Modes |
|
#1
 June 12th, 2007, 06:08 PM
|
||||
|
||||
|
Experimental Chart of Most Effetive Units
With a long break before we receive wave 7 and the new master set, I have decided to attempt to complete a project Ive been working on, on my own, for a while now. The goal of this project is to determine the most and least effective units in the game as well as the relative effectiveness of all the figures in between. Now I know there have been a thousand What Unit Works Best for You threads, but this is different. I want to know precisely what units work the most consistently. I plan on completing this task through a chart Ive created for my own personal games. Below is a picture of a portion the chart:
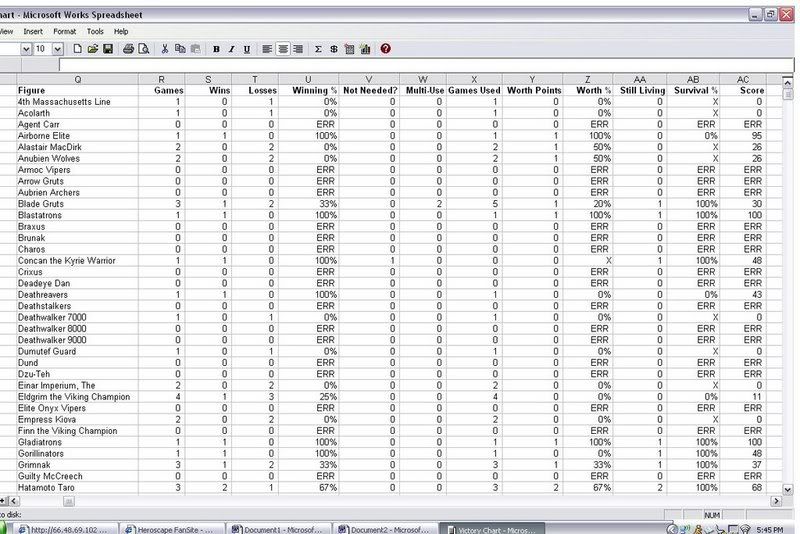 As you can see the chart is not complete, I've only used it for a couple of games. Anyway, this chart is designed to show the effectiveness of each unit based on three categories: win/lose record, effectiveness per game, and survival rate. The three categories are then individually weighted and added to form a final score, the higher the score the more effective the unit. Below is how each category is figured out: 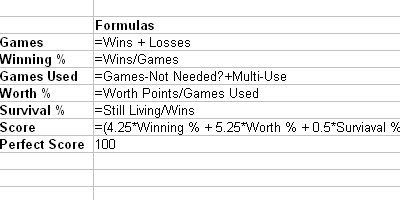 The information in my current chart is based solely on battles that my brother and I have completed in the past month or two. I want to expand this chart to include battles played by all of the Heroscape community. If you wish to contribute to this experiment please pm me the following information: Figures used Multiple commons? Win/lose for each figure Were they actually used or did they just sit there (not needed? column) Were they alive at the end of the battle? And the most crucial element, were they worth their points? This means did they effectively use the amount of points you had to spend to have them on your team. It can be anything from did they kill the same amount of points as they are worth to did their enhancement or ability cause the battle to shift even though the killed no one. An example of a pm that contains everything I need to make this experiment work: Winning Team Zombies of Moridan x2 Deathreavers Deathwalker 7000 Agent Carr Dund Losing Team Minions of Utgar Taelord the Kyrie Warrior Runa the Kyrie Warrior Marraden Hounds Alive at the end: 3 Zombies, Deathwalker 7000 Not Used/Not Needed: Deathwalker 7000 Worth their cost: 1 set of Zombies, Agent Carr, Dund, Marraden Hounds, Runa the Kyrie Warrior If you think this is a good idea/bad idea/waste of time and if you have any questions or comments feel free to post them, I am always open to suggestions. I will post an updated chart every Saturday starting on the 23rd, and as a final note please only pm me the battle statistics if it was a conquest battle, meaning if there was a special objective that caused the battle to end before one team was eliminated do not send me the results because they may interfere with the other data. Feedback: We could all use a little more 
|
|
#2
June 12th, 2007, 06:49 PM
|
||||
|
||||
|
I think this is an interesting idea and could be helpful to an extent. The chart's helpfulness would be stiffled, however, because it does not take into account what other army cards are in a specific battle, if there are multliples of commons, and it can't take into account good or bad play from players.
With that being said, I think it would be interesting for you to compile statistics from a couple hundred games just to see what came out. It would more likely help determine if the heroes are worth their salt.
|
|
#3
June 12th, 2007, 06:55 PM
|
||||
|
||||
|
This is a cool idea. With enough data this should be a very effective and useful guage. I'll try to keep track of information on my games. I'm curious to see how this turns out.
Follow the adventures of Agent Minivann
http://agentminivann.blogspot.com/ http://opensourcevolleyball.blogspot.com/
|
|
#4
June 12th, 2007, 07:05 PM
|
||||
|
||||
|
HSisforcoolkids - I know what you mean about the chart not being one hundred percent effective, but it is the best I could think of. There are so many elements in Heroscape it would be nearly imposssible to keep track of everyone, but this should give a good idea of the effectiveness of certain figures. One correction to your statement, the chart does take into account the use of multiple commons in the "Multi-Use" column.
Thanks Agent Minivann! I hoping that by the time each figure has about 50 games documented then patterns will begin to emerge as to who is very usuful and who is way over-priced. Feedback: We could all use a little more
|
|
#5
June 12th, 2007, 07:25 PM
|
||||
|
||||
|
It's an intriguing idea and could be pretty fun with enough data points. Not sure how you determine whether or not a support fig is "worth their points" though. I'd love to see the results, but I admit to a certain ambivilence regarding their value.
~Aldin, incalculably He either fears his fate too much or his desserts are small That dares not put it to the touch to gain or lose it all ~James Graham
|
|
#6
June 12th, 2007, 07:39 PM
|
|||
|
|||
|
Just a few comments, but I think this can be a good thing.
As Aldin mentioned support figures are subjective to worth their value or not. An example are the rats. While I think the rats might have given me the game by tying down your krav, another person in the same situation might not. Not to mention what happens when I draft rats, and you have no ranged units, some people might think that the rats were worth it as glyph grabbers, while others would say no. My second comment is the survival category, granted it is not as weighted as worth or the wins columns, but it does affect the over all score. I don't think I am going out on a limb when I say that some figures full potential is not realized unless they die. (The Viking Heroes, and Alastair Mcdirk, since you seem to be counting total life left in the still living column) The other problem with the survival column is that units that never leave the starting zone would get a bump in their final score. I just hope Aquilla doesn't summon me any time soon.
|
|
#7
June 12th, 2007, 07:56 PM
|
|||
|
|||
|
I like it. I've always been a numbers kind of guy and I think this is a bit on the right track. If anything, you might be able to make adjustments in your constants once you have gathered enough data.
Rather than have us send you a slathering of data why don't you upload the spreadsheet and let us track our own data for a while then send you are filled out spreadsheets a month at a time. This would also give me a chance to tweak it or give applicable suggestions on variables and constants. 
|
|
#8
June 12th, 2007, 08:21 PM
|
||||
|
||||
|
Aldin/Dumb Dwarf - Your thoughts about the subjectiveness of the effectiveness (that sounds weird) of support units is understandable, but I do not see how that problem can be avoided. I think we must take it that those of us at heroscapers.com have enough experience with the game to know when our picks were usuful or if they just didn't get the job accomplished. I think we just have to take it for granted that people know when figures are worth their cost.
The second comment by Dumb Dwarf is also appropriate. When I first created the chart I figured that if a figure survived then it had a greater effectiveness. Your example with the Viking Heroes makes a very convincing arguement to get rid of that category and make Winning % be 45% of the score and Worth % be 55%. TheRealQ - Thanks. Thats a good suggestion. I will upload the spreadsheet and those who want it can download it. I'll make the monthly data to be pm or posted by the 1st of every month so that i can add it to the master chart. For people who don't want to keep track of the battles for a month, there will still be the option to pm me results for individual battles and i will still post the chart on Saturdays.[/i] Feedback: We could all use a little more
|
|
#9
June 12th, 2007, 08:24 PM
|
||||
|
||||
|
Good stuff.
If you want to send me your spreadsheet I can trap for the ERR messages and replace them with 0 or blank. Let me know. -Matt (MS Excel Geek)
|
|
#10
June 12th, 2007, 09:54 PM
|
||||
|
||||
|
This sounds like a good idea and I too think it can be very useful in the future. But remember, it's gonna take a lot of games for the data to be as close to the actual worth of that figure, you have to do like 10 games at least for each figure. Good luck!

|
|
#11
June 12th, 2007, 10:23 PM
|
||||
|
||||
|
Thanks Bixby. My computer has Microsoft Works though, not Excel. Can you still do that?
And Gforce thanks for the support. My hope is that many different users will submit stats about their battles so that the process of collecting data does not take too long. If 10 users submitted the states for a 500pt battle each then we'd already have about 100 games on record. (about 5 figures for 500pts x 2 for opponent x ten users) There are 102 figures so if that scenario happened for ten days then there would already be enough information to formulate some type of pattern and start to analyze the data. If you carried this process on for the entire month the numbers could easily become factual. The key is that other users help me out with their battle information, if I have to rely on my own data it would take a lot longer than the communities data and it would also be less accurate. Feedback: We could all use a little more
|
|
#12
June 12th, 2007, 10:54 PM
|
||||
|
||||
|
I'll be sending you my data when I have it. Cool idea, man.
|
|
|
|||||||
|
|


 Linear Mode
